Heat Flow and Physical Properties Package (HP3) and Radiometer (RAD)
 Heat Flow and Physical Properties Probe (HP3)
 Radiometer (RAD)
mission specific
NOTE
Radiometer became the only HP3 data in the archive. The AN displays these data under the "RAD" heading throughout to emphasize the origin and nature of the data.Introduction
The purpose of the HP3 instrument is to determine geothermal heat flow at the landing site (Spohn et al., 2014), which is interpreted in terms of the global heat budget (Grott and Breuer, 2010, Dehant et al., 2012, Plesa et al., 2015). This measurement is augmented by a determination of the surface brightness temperature using the HP3 radiometer (RAD) to determine the forcing function for the subsurface temperatures. To measure heat flow, a self-hammering mole will emplace a suite of temperature sensors and heaters (the TEM sensor suite) into the subsurface. The progress of the mole is monitored by the tether length monitor (TLM), which measures the length of tether being paid out, and the static tilt meter (STATIL), which determines the inclination of the mole with respect to vertical.
- The instrument consists of the following functional subunits:
- Back End Electronics (BEE), located in the lander warm electronics box
- Engineering Tether, electrical connection between the Support System and the BEE
- Support System (including TLM, the science tether, and the mole), which will be deployed onto the surface
- Science Tether (TEM-P), which will be emplaced into the ground by the mole
- Mole (including TEM-A and STATIL)
- Radiometer (RAD), which is mounted under the lander deck
The main hardware elements are shown in the figure below, where the deployed elements of HP3 (Mole, TLM, and Science Tether) are shown in the left panel, whereas the lander mounted elements (RAD and BEE) are shown in the right panel.
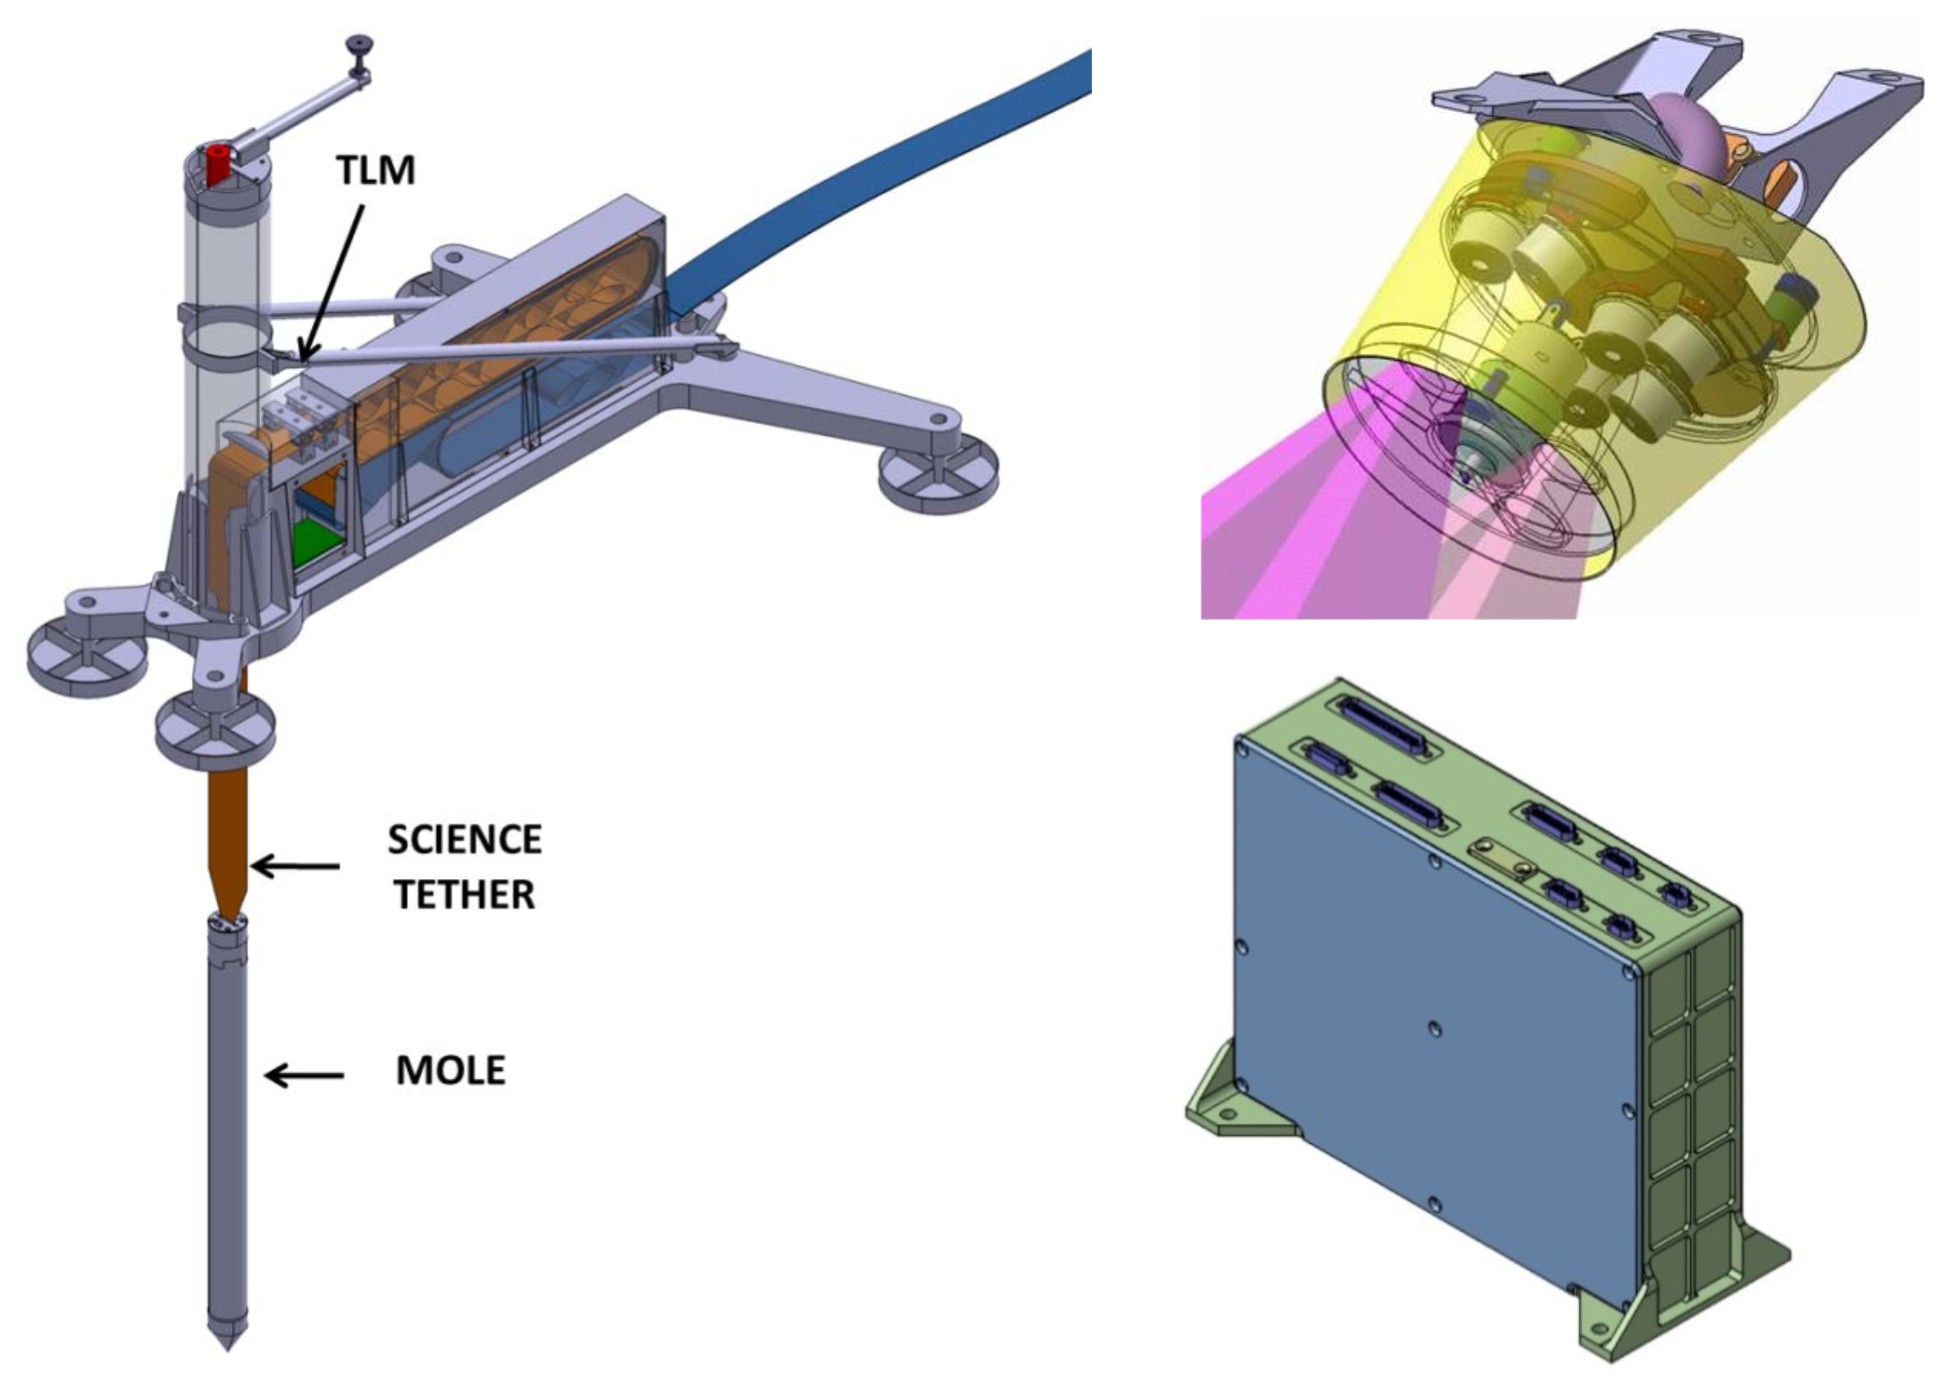
Left: HP3 Deployed Elements including the Mole, Science Tether, and Tether Length Monitor (TLM). Top Right: Radiometer, mounted under the lander deck, indicating the location of the six thermopile sensors and their respective fields of view. A/D conversion is done in the radiometer sensor head. Bottom Right: Backend electronics housing the circuitry for temperature (TEM) and tilt (STATIL) measurements.
A functional block diagram of the instrument is shown in the figure below, where science sensors are indicated in yellow. TEM-A thermal conductivity sensors as well as TEM-A temperature sensors are operated from the BEE, routing the signals through the engineering and science tethers. In this way, thermal disturbance of the regolith is kept at a minimum while operating these subsystems. The same approach is followed for the STATIL and TLM systems, where analog to digital conversion is also performed by the BEE. On the other hand, the radiometer does have A/D conversion electronics integrated in the sensor head, having a purely digital interface to the BEE.
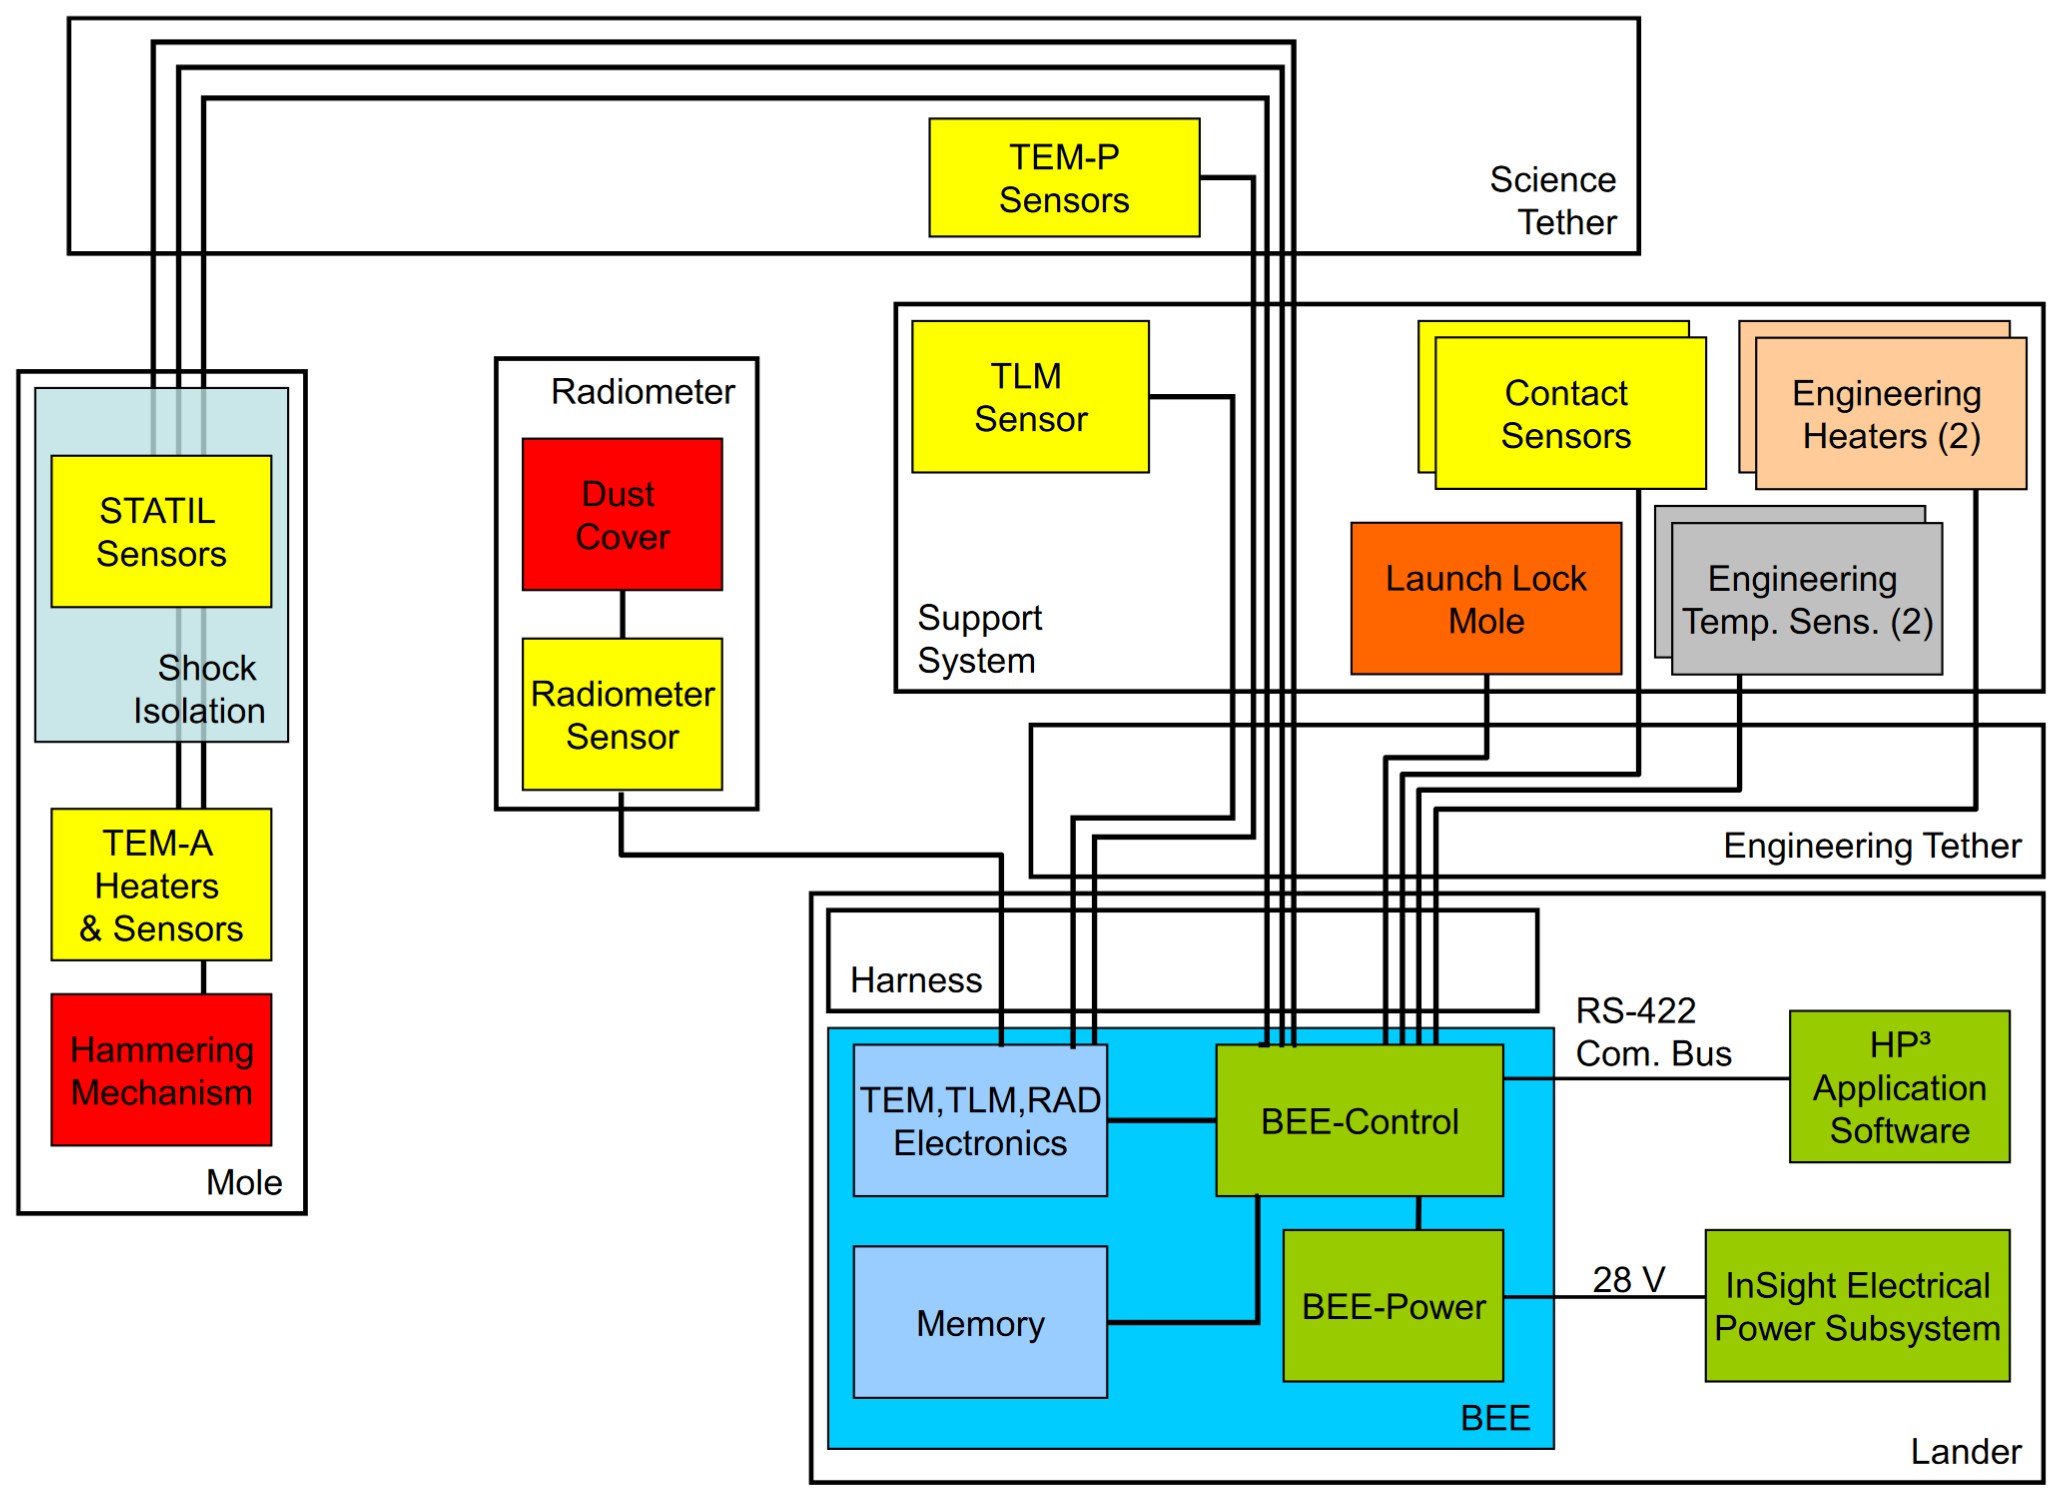
Functional block diagram of the HP3 instrument indicating the lander mounted BEE, the engineering tether connecting the BEE to the deployed elements, the support system, the science tether, and the mole. Sensors are indicated in yellow, whereas mechanisms are indicated in red. Software and power interfaces are indicated in green.
Science objectives
Heat flow determination
The level 1 science objective of the HP3 experiment is a determination of the surface heat flow F at the landing site with an uncertainty of better than ±5 mW m-2 (see Grott et al., 2015). Heat flow, or to be more precise the heat flux density, is generally assumed to be one-dimensional from a planet as first approximation, and is given by the 1-D form of Fourier’s Law (e.g. Grott et al., 2007, Kömle et al., 2011) where the negative sign is commonly omitted for convenience:
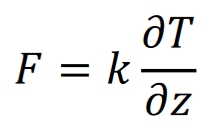
Here, k is the regolith thermal conductivity, T is temperature, and z is depth. HP3 measures temperature T using the TEM-P PT100 resistance temperature detectors (100 Ω at 0°C platinum resistance temperature sensors), depth z using the inclinations determined by STATIL and length determined by TLM, and thermal conductivity k using a the TEM-A temperature sensors and heaters (e.g., Kömle et al., 2011).
Surface brightness determination
The HP3 Radiometer (RAD) will measure the surface brightness temperature of the Martian regolith inside its field of view with an uncertainty of better than 4 K. From these measurements, the shape of the forcing function for subsurface temperature fluctuations shall be determined. In addition, measurements of surface brightness temperatures will allow for a determination of the surface thermal inertia at the landing site.
Detectors
Science tether temperature measurements
HP3 measures the subsurface temperature gradient using PT100 sensors mounted on the science tether. The distribution of temperature sensors along the tether varies with length as shown in the figure below. Sensors are stacked more closely towards the mole to increase the number of sensors unaffected by the annual temperature wave. At the same time, sensors near the surface can be utilized to determine the thermal diffusivity of the regolith from an analysis of the attenuation of the annual temperature wave as a function of depth.
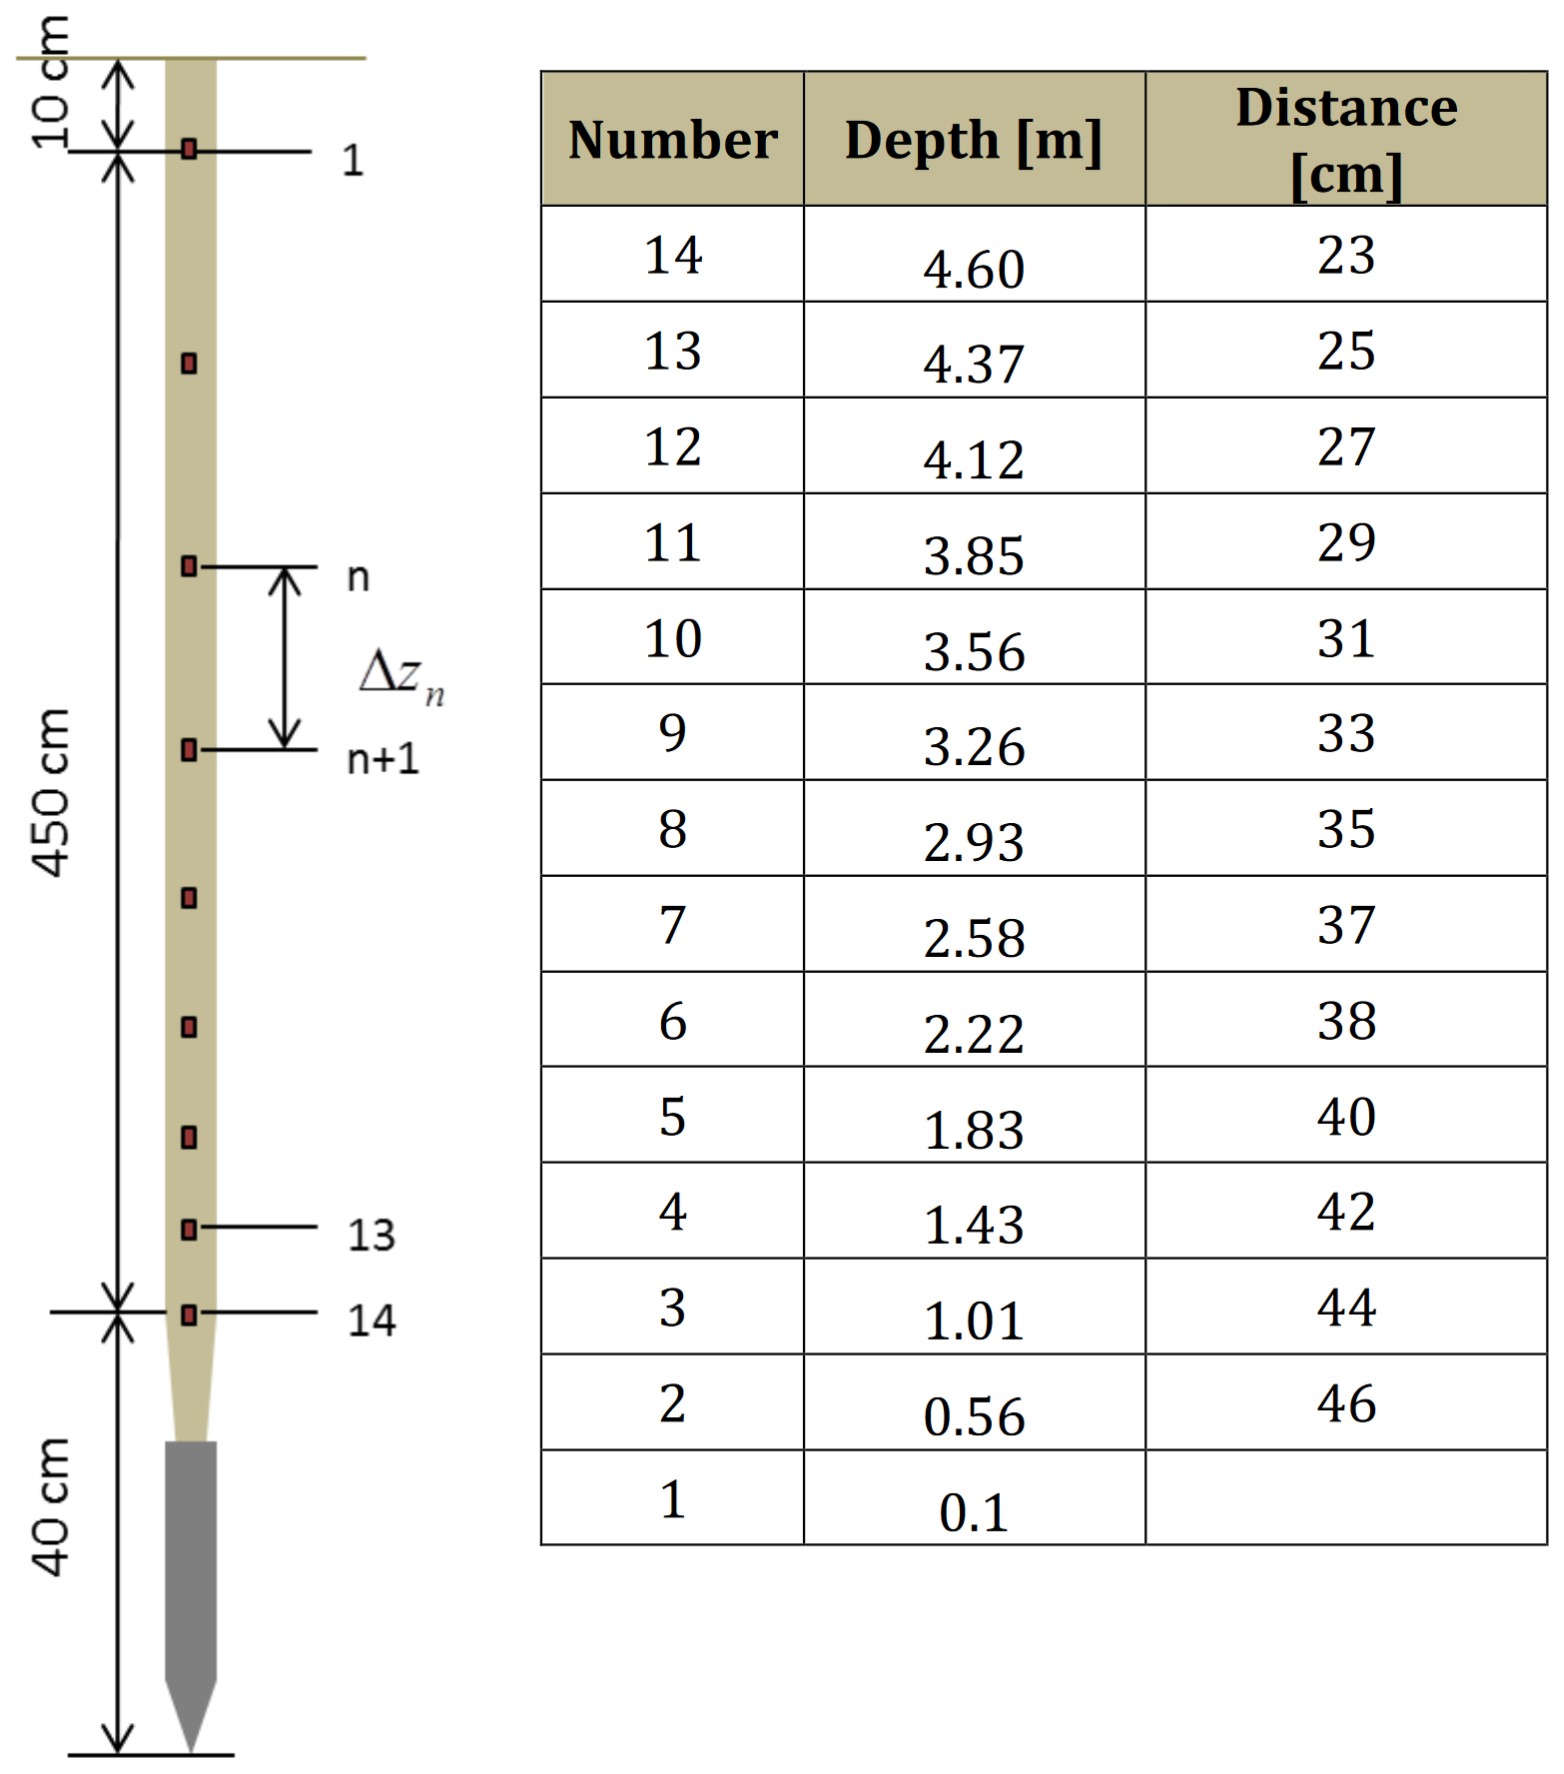
Distribution of sensors on the HP3 Science Tether. Depth of the sensor assuming vertical penetration and length between adjacent sensors are given.
Tether length measurement
The length of extracted tether is determined by optical sampling of position codes on the science tether by the tether length measurement system (TLM) operated always during Mole release and Mole operation.
Mole tilt measurement
The STATIL subsystem uses two Dual-Axis Accelerometers to determine the attitude of the HP³ mole in reference to the planetary gravity vector. It is used together with the TLM to determine the path and depth of the mole in the Martian subsurface. Signal output is a voltage that is proportional to the angle of the mole vs. the gravity vector. The accelerometers are mounted on two PCBs in the rear of the mole that are attached to a sled made of stainless steel. In nominal working position the longitudinal axis of the sled is equal to the hammering axis of the mole.
The shape of the sled and mounting orientation of the sensors has been designed such that the sensors yield maximum signal. Therefore the sensor PCBs are almost perpendicular to the hammering axis. For redundancy two sensors have been used. The accelerometers that form each pair are mounted at 45° to each other; each pair of accelerometers has an 80° tilt from the mole axis to provide the highest sensitivity measurement position within the range of the deployment angle of HP³.
The selected STATIL sensors are dual-axis ADXL203 accelerometers built by Analog Devices. These are high precision, low power, complete dual-axis accelerometers with signal conditioned voltage outputs, all on a single, monolithic IC. The STATIL subsystem is connected to the HP3 BEE via the Science Tether, the Support Structure and the Engineering Tether. To decrease the influence of electronics noise, a low-pass filter is implemented in the BEE. One filter is used for every analogue STATIL signal and voltages are converted using 24-bit analog-to-digital converters. The BEE is able to trigger on STATIL signatures caused by hammer strokes. The trigger level is adjustable.
Thermal conductivity measurement
HP3 measures thermal conductivity by using the mole as a modified line heat source. This approach consists of injecting a known amount of heat into the probe and measuring the probe’s self-heating curve.
For a finite length cylinder such as the mole, the heating curve takes the form
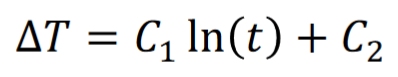
where t is time, and the constant C1 is primarily a function of heating power and regolith thermal conductivity, while C2 is a function of the probe’s heat capacity and the contact conductance between probe and regolith. Therefore, thermal conductivity can be determined from
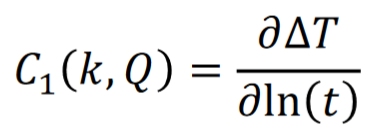
by direct numerical simulations if the heating power is known. The TEM-A heaters are Kapton based copper heaters that are glued to the outer casing of the mole and protected against abrasion by aluminum covers. Due to the large temperature coefficient of resistance of copper, the heaters simultaneously act as temperature sensors, and the TEM-A electronics inside the BEE measures the heating power Q as well as the resistance of the heaters to determine the self-heating curve as a function of heating power.
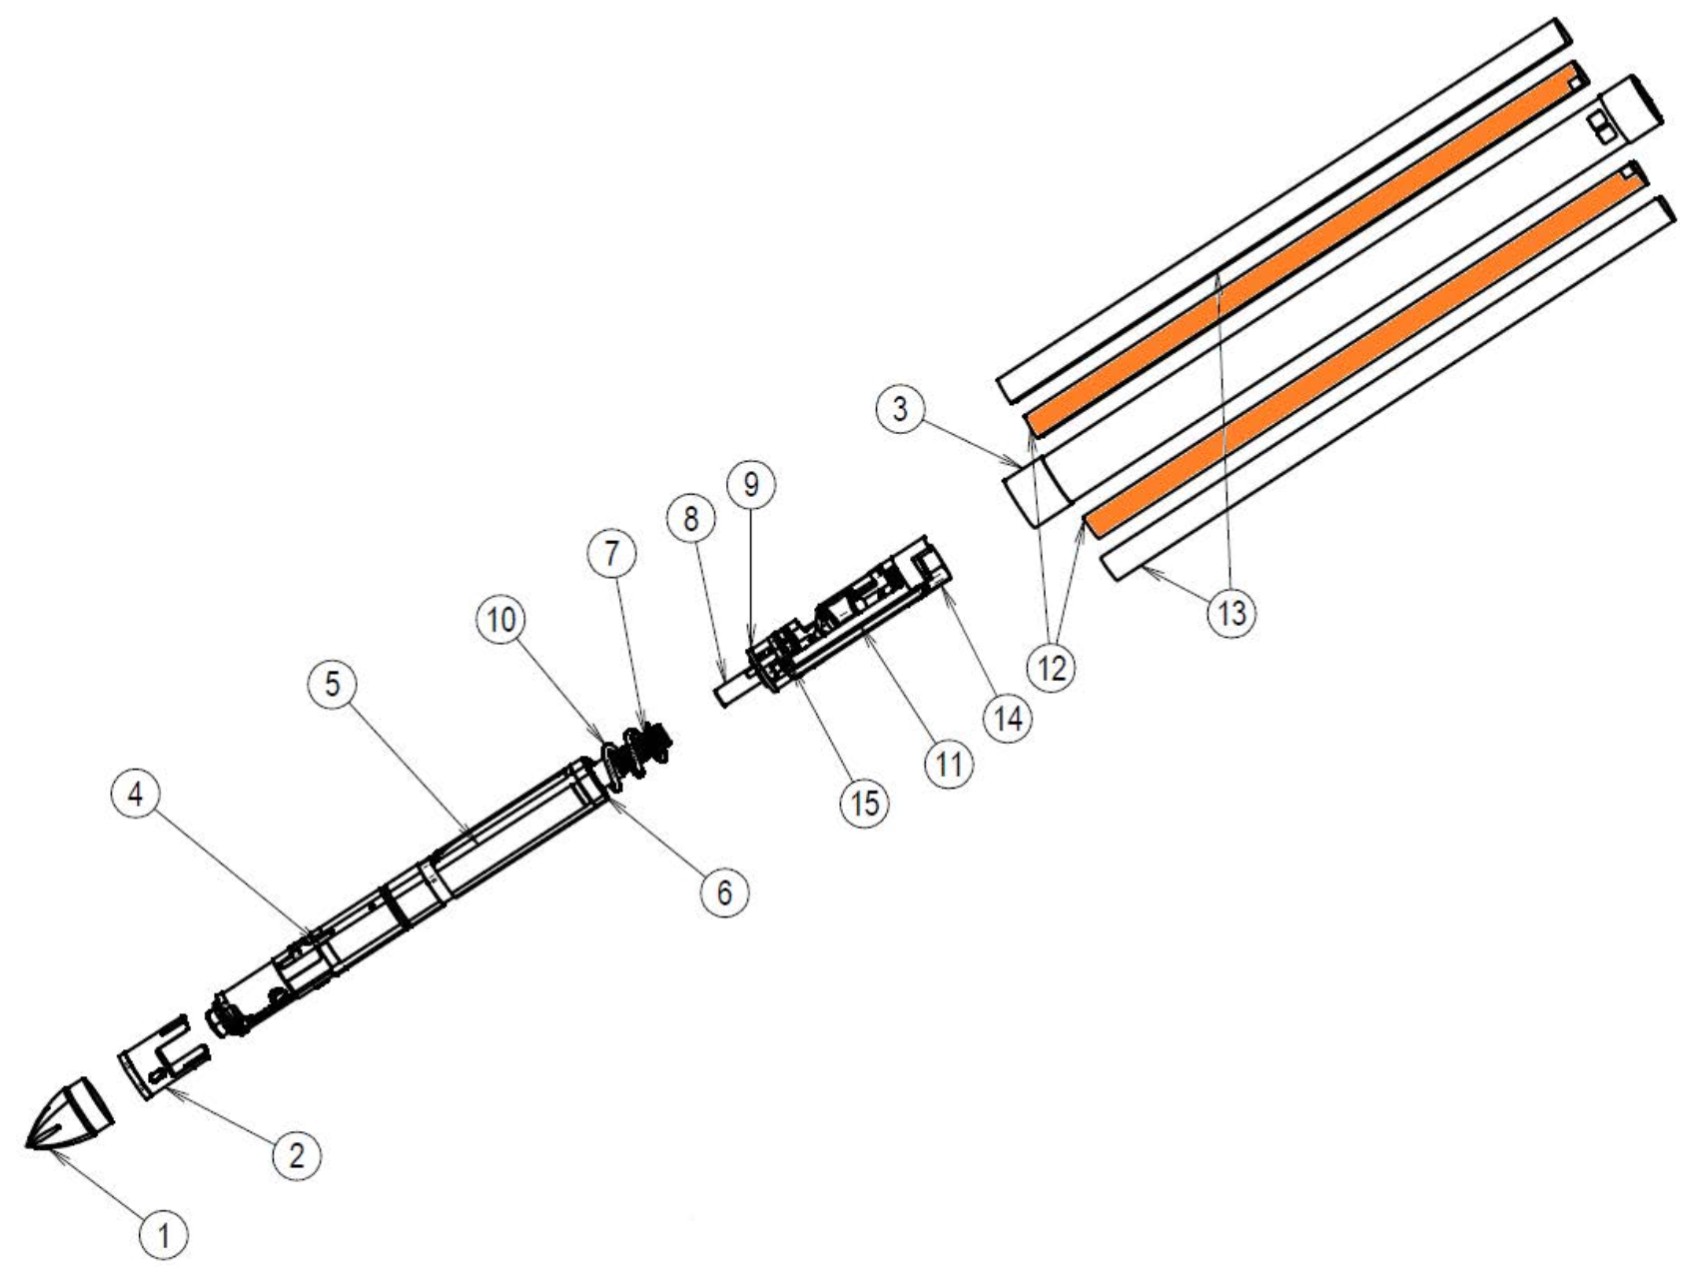
Expanded view of the mole, indicating the TEM-A heating foils (12) in orange. The foils are glued to the mole outer casing (3) and protected against abrasion by the TEM-A covers (13). Other parts refer to the hammering mechanism and STATIL assembly.
Radiometer (RAD)
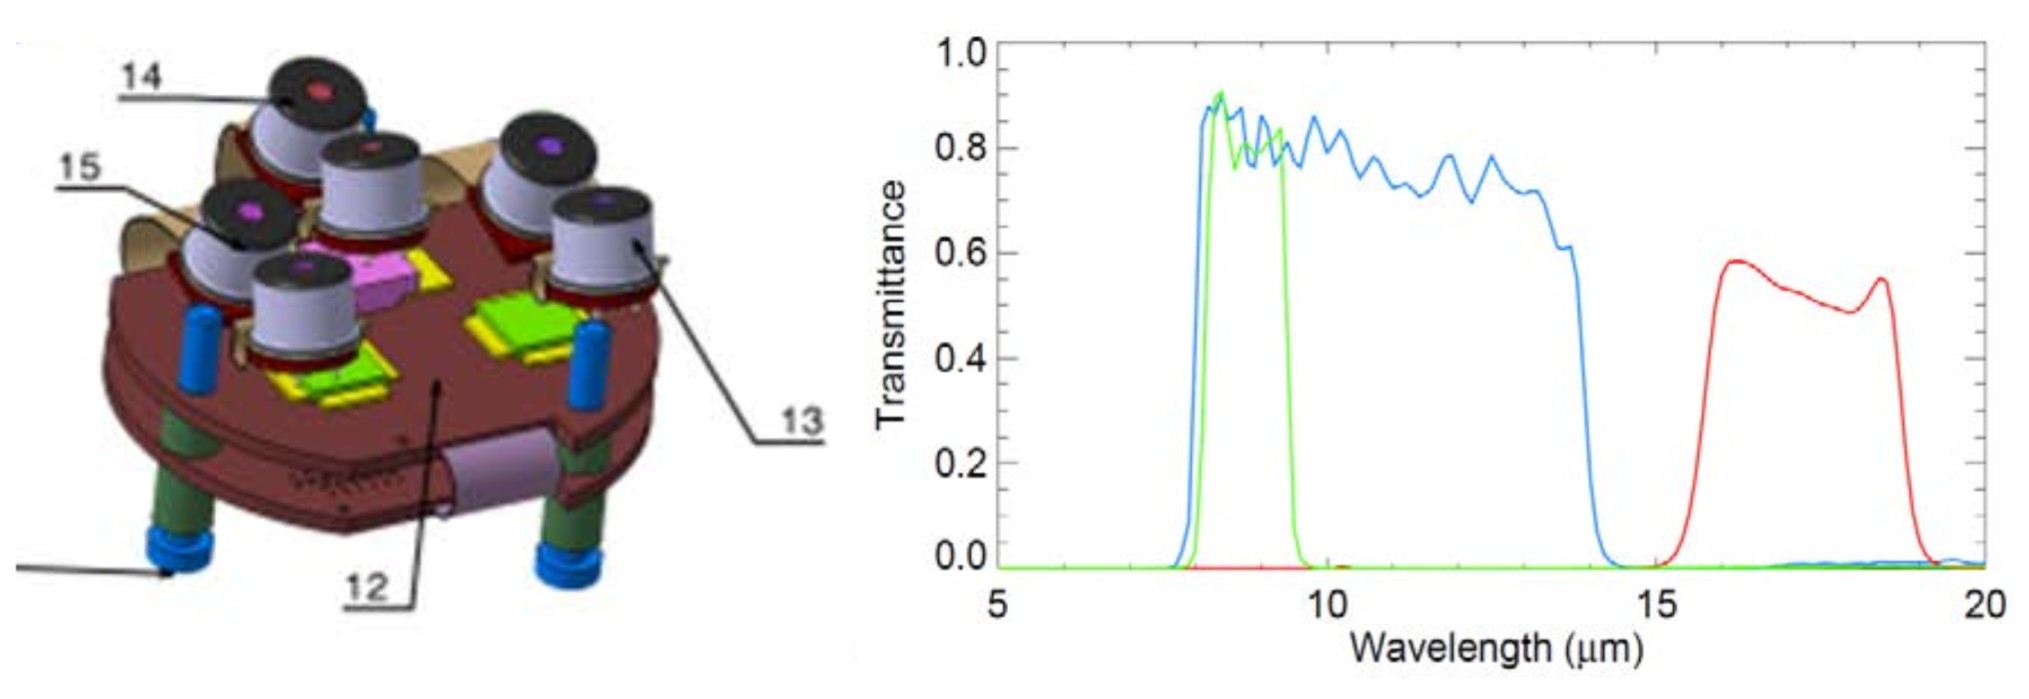
Left: PCB and sensor assembly of the RAD. Six thermopile sensors (13, 14, and 15) are accommodated, and each filter wavelength is used with 2 sensors. Right: Transmittance of the three spectral filters multiplied with the spectral absorbance of the thermopiles. Blue: 8-14 μm bandpass, green: 7.8- 9.6 μm bandpass , red: 16-19 bandpass.
The radiometer measures surface brightness temperatures using TS 72 thermopile sensors from the Institute of Photonic Technology, Jena, Germany (see http://www.ipht-jena.de/fileadmin/user_upload/redaktion/pdf/Datenblaetter/TS-72- 2011-10- 28.pdf). The sensors consist of an IR filter and absorbing surface, which is in radiative equilibrium with the target surface in the instrument’s field of view. The temperature of the absorbing surface is determined using Bi0.87Sb0.13/Sb (Bismuth-Antimony) thermopairs with an electro-motive force of EMF = 135 μV/K. The absorber area is 0.2 mm2. The generated thermal voltage measures the temperature difference between the junctions of the thermocouples, which in turn is a measure for the net radiative flow of heat between absorber and target.
Sensors are mounted such that 3 thermopiles cover two fields of view each. PT100 sensors mounted inside the sensor housing measure the cold junction temperature. Therefore, a total of 12 signals are recorded: 6 thermopile voltages corresponding to 3 bandpass filters in two fields of view each, and 6 corresponding cold-junction temperatures measured by PT100 sensors.
The fields of view (FOV) are geometrically limited by the sensorhead apertures to 20°. In addition to that a calibration target obscures a part of this 20° circular FOV view. Its temperature provides part of the thermopile signal and is measured by another PT100 sensor. As in the Remote Sensing Mast Ground Temperature Sensor (REMS-GTS0) radiometer on MSL, a calibration target is partially in the FOV. The FOV is in effect reduced by 30% in solid angle. The temperature of the calibration target is controlled by a heater and PT100 temperature sensors.
The sensors and optical apertures are mounted to the lander such that the three sensors have their boresights pointed downward at 55° relative to the lander deck plane (FOV1), and the other three sensors at 25° relative to the lander deck plane. The figure below shows the location of the footprints for the nominal case, when the lander deck is not tilted relative to the surface and the solar panels oriented east-west and the instrument deployment workspace to the south. The azimuth of the RAD FOVs is in this case 20° west of north.
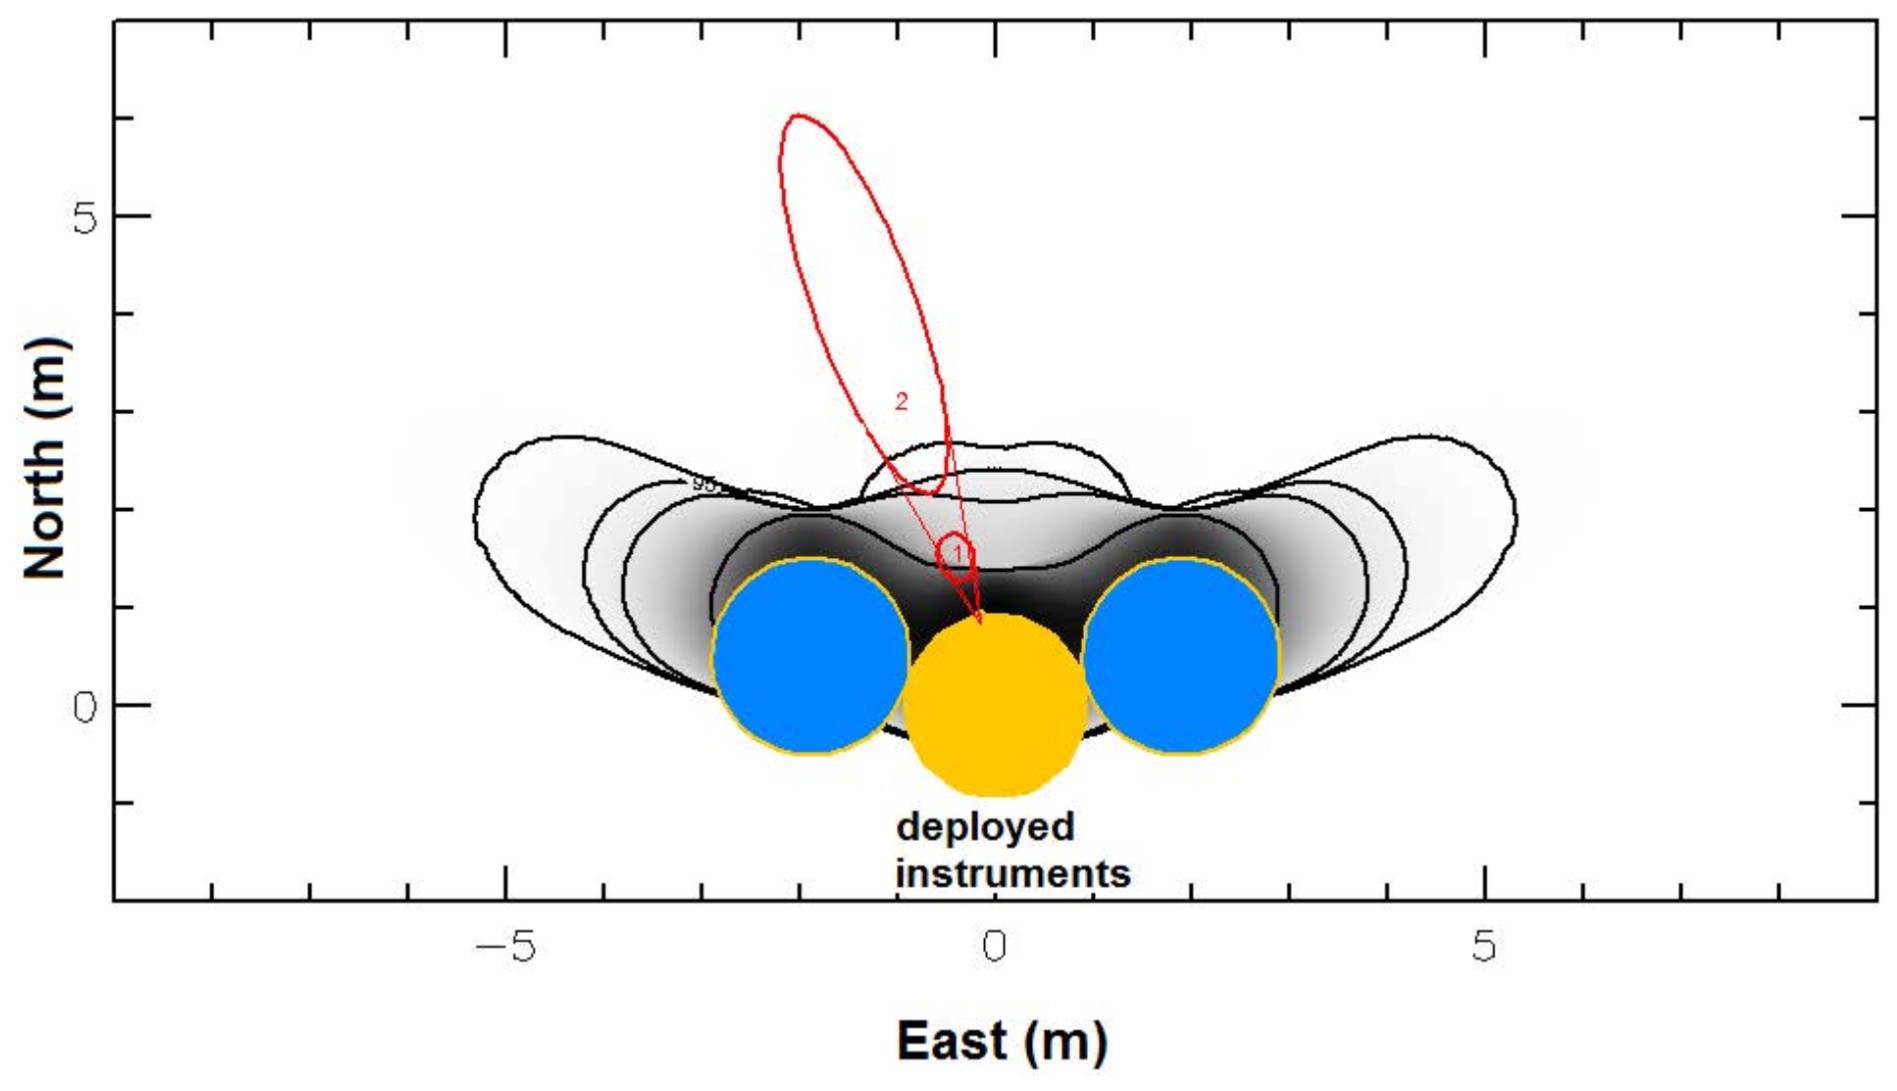
Location of nominal RAD footprints relative to the lander (yellow: deck, blue: solar panels) and its shadow during the landing season plotted as relative loss of daily insolation in grey. The isolines from the outer to inner correspond to 99%, 95%, 90% and 50% of the direct insolation without the lander. The HP3 mole and SEIS will be deployed south of the lander. The radiometer points to the north. The calibration target further limits the FOVs of the radiometer towards nadir and horizon relative to the figure.
Science tether temperature measurements
TEM-P measures temperatures using 14 PT100 temperature sensors, which are distributed over the entire length of the Tether. Sensors are read by the HP3 BEE by sourcing current and measuring the voltage drop over the sensor elements in a 4-wire (Kelvin Method) configuration. Two redundant measurement circuits are used. PT100 sensors are alternately routed to one out of two ADCs, such that all even numbered PT100 are measured by one ADC and all odd numbered sensors by a second ADC.
The ADC is operated at an oversampling rate of 4.8 kHz, and values are averaged in a field programmable gate array to one sample. Typically, 600 samples are taken per channel, the first 88 of which are discarded to avoid transient effects after switching of a multiplexer channel. The 512 remaining samples are then again averaged to one value. Sampling all channels of the ADC then takes 2s, and this measurement includes the nominal and offset voltages.
Instrument operation
HP3 operations
During deployment, SEIS will be deployed from the lander deck to the surface, followed by its wind and thermal shield, followed by HP3. The instruments will be deployed on the south side of the lander. If the terrain within the deployment zone permits, HP3 will be deployed 1 m from SEIS and up to 2 m from the lander. The rock or slope distribution within the landing zone could cause a departure from this nominal configuration.
After deployment of the instrument onto the surface of Mars by the InSight robotic arm, operations of the HP3 instrument is split into two main mission phases:
- The penetration phase
- The monitoring phase
During the penetration phase, the HP3 mole will hammer itself into the subsurface, trailing behind the science tether, which is equipped with temperature sensors to measure the thermal gradient. At intervals 35 of 50 cm, hammering will be interrupted, and the heat introduced into the regolith will be allowed to dissipate for a period of at least 2 days. After this time, a TEM-A measurement will be performed, and the thermal conductivity of the regolith will be determined. Heating times for the TEM-A measurement will be up to 24 h to sample a volume of regolith away from the mole. After the conductivity measurement, hammering will be resumed until the next stop. In this way, a profile of thermal conductivity at the landing site will be compiled. During the penetration phase, 10 stops and measurements are planned. The timeline for this mission phase is schematically illustrated in the figure below.
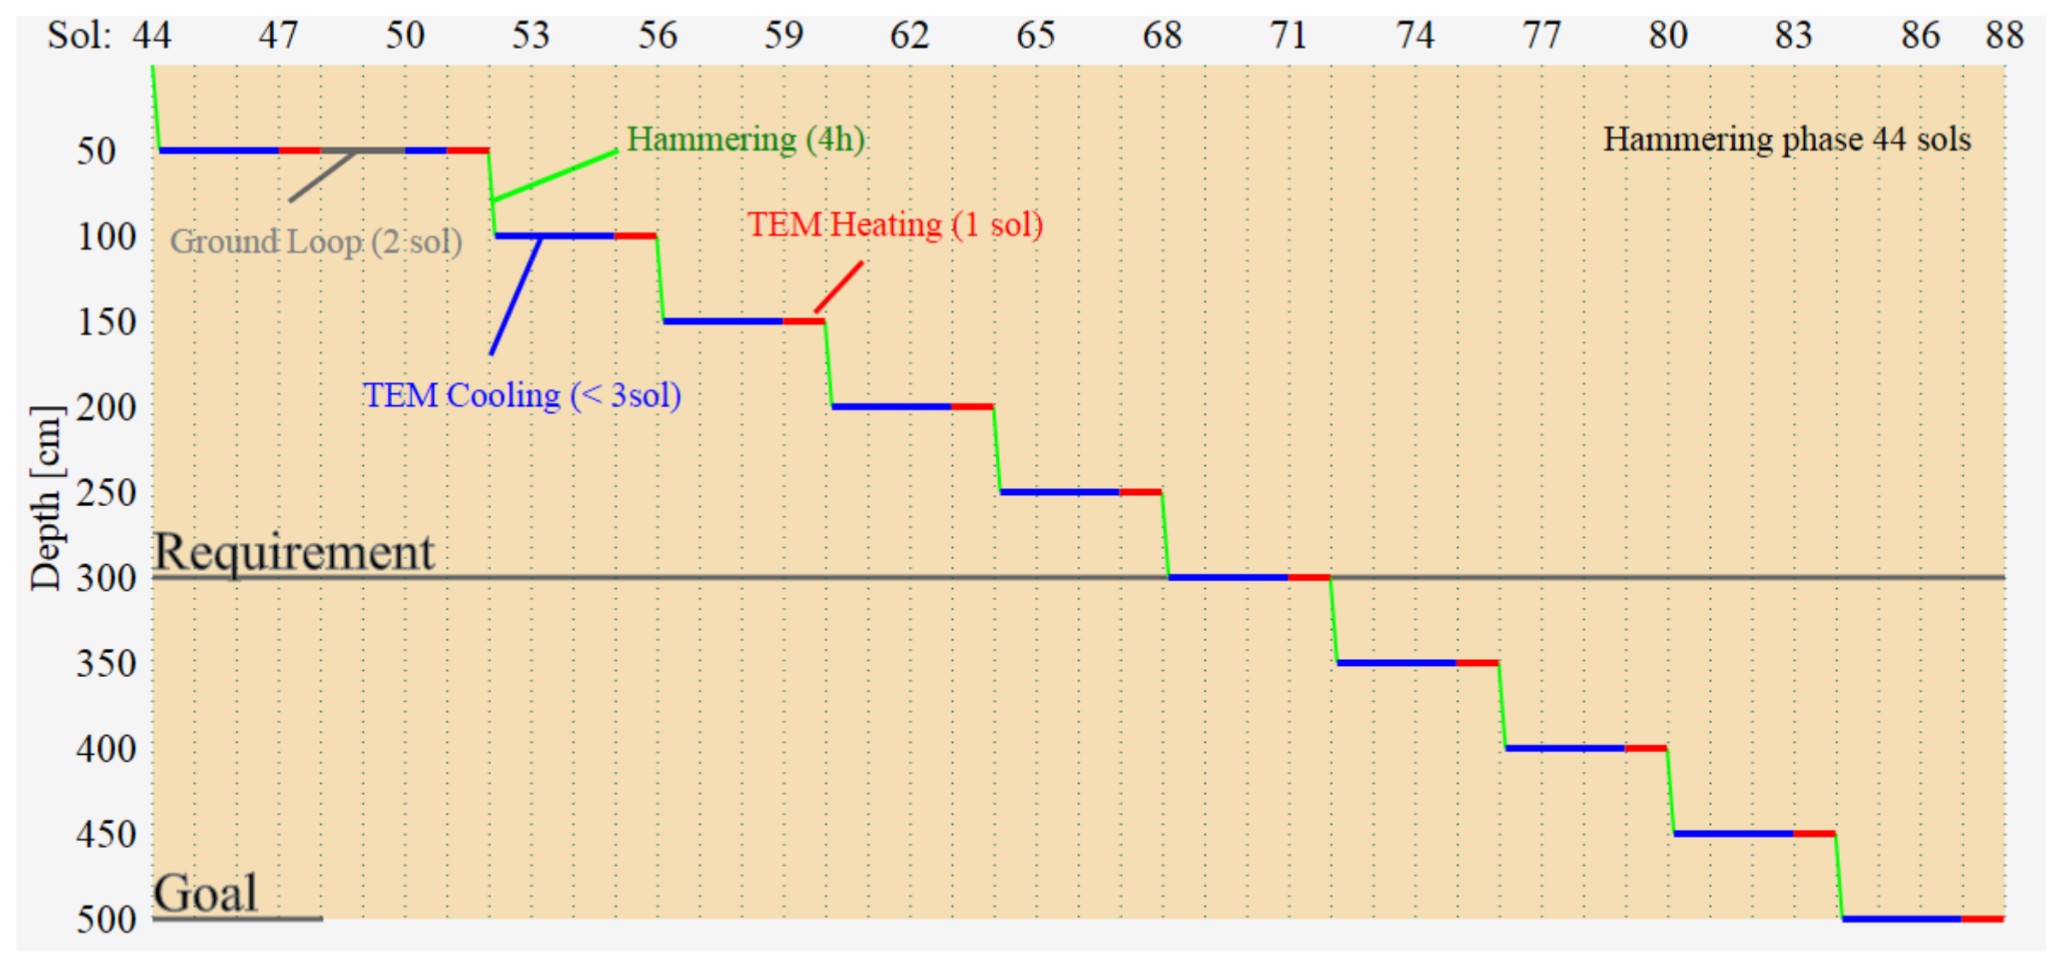
Operations of the HP3 instrument after deployment. Phases of hammering, cooldown, and thermal conductivity measurements (TEM-A) are indicated.
Progress of the mole is continuously monitored by the STATIL tilt meters and TLM, which measures the length of paid out science tether. Taken together, this information uniquely determines the mole path and depth, from which the depth of individual temperature sensors can be derived.
After reaching the final depth, which is limited to 5 m by the length of the tether, but might be smaller depending on the penetration performance of the mole, HP3 enters the monitoring phase. During this mission phase, HP3 takes periodic temperature measurements using the sensors on the tether. Readings are to be taken during 5 min every hour, and values are averaged to yield a sampling of the subsurface temperature field every hour to the end of mission.
RAD operations
The radiometer typically operates in one of four modes, which determine the timing of measurements and temperature of the instrument.
- The ‘Hourly’ mode acquires 24 measurements per sol, each 20 samples over 5 min. This mode is run for at least one sol within each interval of 29 sols.
- The ‘Standard’ mode acquires 4 measurements per sol, each 20 samples acquired over 5 min. This mode is run continuously unless there is another mode or the radiometer has to remain off due to power/energy constraints.
- The ‘Single’ mode is equivalent to a single observation of the standard mode. After entering the mode the radiometer warms up to one of the calibration points, equilibrates for 1 hour and then acquires 20 samples over 5 min. Timing of telecommand execution, and telecommands to adjust the sampling rate (up to 0.5 Hz), equilibration duration and measurement duration are available to allow for flexible observations of events that are expected to occur at certain times of the day, such as eclipses and shadows moving into the FOV.
- Calibration mode acquires 6 measurements in 6 h, each with 100 samples, while changing the calibration target temperature.
Modes 1 and 2 run continuously until commanded to idle. In these modes the measurements are within a few minutes synchronized with local true solar time. For standard mode the four measurements are planned for approximately 2 am, 5 am, 2 pm, and 5 pm local time. It is possible to measure at other specified times of the day using the ‘Single’ mode (see above).
The radiometer sensor head is temperature stabilized using heaters, and as thermopile sensitivity is a function of temperature the instrument is operated at pre-launch calibrated setpoints. As no cooling is performed, the radiometer temperature must be above the ambient temperature for efficient cooling to the environment. To reduce energy consumption and measurement uncertainty the radiometer temperature control is adjusted to the diurnal cycle. There is one setpoint for night (Tnight = -35°C) and one for day (Tday = -5°C). A third temperature setpoint (Thot = 25°C) is used instead of Tday if the environment is unexpectedly warm.
The switch from the night to the day/hot day setpoint occurs at approximately 9 am local true solar time in the hourly mode, and between the am and pm measurements in the standard mode. The switch from day to night temperature setpoint occurs at approximately 7 pm local true solar time in the hourly mode and between the pm and the am measurements in the hourly mode. In the single and calibration mode one of the three temperature setpoints is selected upon entering the mode.
The temperature of the calibration target/dust cover is stabilized at the same temperature as the sensorhead body for the ‘Hourly’, ‘Standard’ and ‘Single ‘ modes. During the ‘Calibration’ mode the target temperature is varied relative to the sensorhead body.
Calibration
Science tether temperature sensor calibration
HP3 temperature sensors are calibrated using a comparison calibration approach, in which the science tether, including the PT100 sensors, is exposed to a controlled temperature environment, whose temperature is simultaneously monitored by a calibrated reference sensor. All measurements are executed using a 4-wire (Kelvin) resistance measurement.
The error budget for the calibration takes into account contributions from the measurement electronics, as well as contributions from the thermal setup. Major factors controlling the error budget are the homogeneity and stability of the calibration bath, the calibration uncertainty of the reference thermometers, as well as the fitting residuals with respect to the Callendar-van Dusen equation. Contributions from the electronics are generally small. In total, the 1-sigma confidence interval for the calibration uncertainty of the HP3 PT100 sensors is 12 mK.
Tether length measurement calibration
The TLM measures relative and absolute tether length codes and does not need to be calibrated.
Mole tilt measurement calibration
For calibration, the STATIL accelerometers are mounted flat on a 3D rotation table. The rotation table is then rotated in 0.5° increments along the gravity vector to determine the sensor characteristics and the min and max output of the accelerometers for the different axes. Values are recorded using the HP3 BEE. The calibration is performed before STATIL assembly and integration into the HP³ mole. An in-flight calibration is not possible. The main goal of the calibration of the STATIL subsystem is to measure the minimum and maximum output voltage of each axis of each accelerometer under 1 g conditions.
Thermal conductivity sensor temperature calibration
The calibration procedure for the resistance vs. temperature calibration of the TEM-A foils follows the same reasoning as that of the science tether PT100 sensors and uses similar hardware. TEM-A foils are connected to the data logger using a 4-wire (Kelvin) measurement configuration. Calibration data is corrected for offset and gain. In total, the 1-σ confidence interval for the calibration uncertainty is 30 mK.
Estimated total heat flow uncertainty
As stated above, heat flow, F, is a function of thermal conductivity, k, and thermal gradient, ∂T/∂z, and is given by:
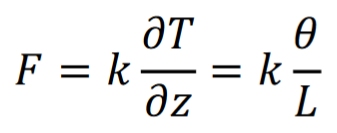
The thermal gradient is determined from a measurement of the temperature difference between different sensors, θ, and their vertical separation, L. Thermal conductivity is determined from a line -heat source method by providing a known power to the probe and measuring the temperature rise. It is given by:
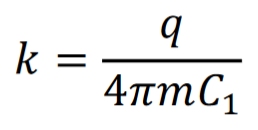
where q is the heating power per unit length provided to the mole, which is given by:
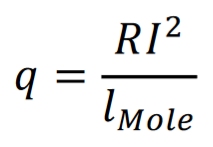
Here, R is the resistance of the heating foils, I the heating current, and lMole is the length of the mole. The logarithmic temperature rise m of the probe is given by:
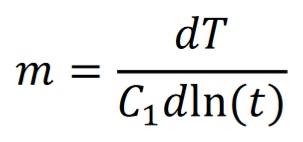
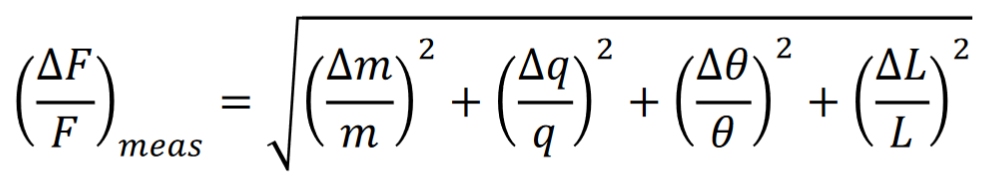
A thermal mole model adapts the ideal line-heat source method to the mole geometry, and is verified by tests, which provide the scaling for C1 given by ∂T= C1 ln(t) + C2. In total, the measurement induced heat flow uncertainty is then given by:
In addition to the measurement errors themselves, heat introduced into the regolith by the HP3experiment influences the retrieved heat flow. The three sources of HP3 induced errors are:
- Mole induced heat influences the thermal conductivity measurement by influencing m
- Mole induced heat influences the thermal gradient measurement by influencing dT between sensors
- Short duration (less than 1 Martian year) measurements add uncertainty to the determination of the average annual temperature at each sensor.
Gaussian error propagation for these errors then results in the final error budget:
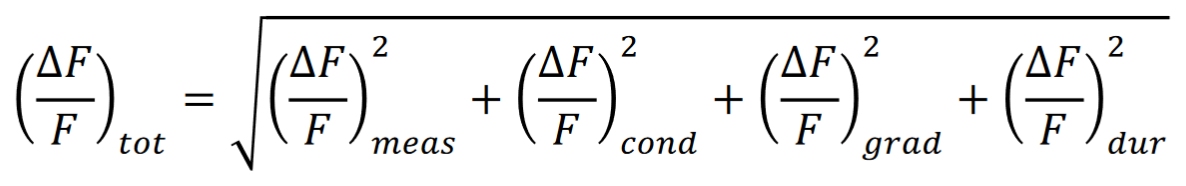
In total, for a nominal heat flow at the landing site of 20 mW/m2, the error budget given in the table below is obtained, and a total error of 3.3 mW/m2 is estimated.
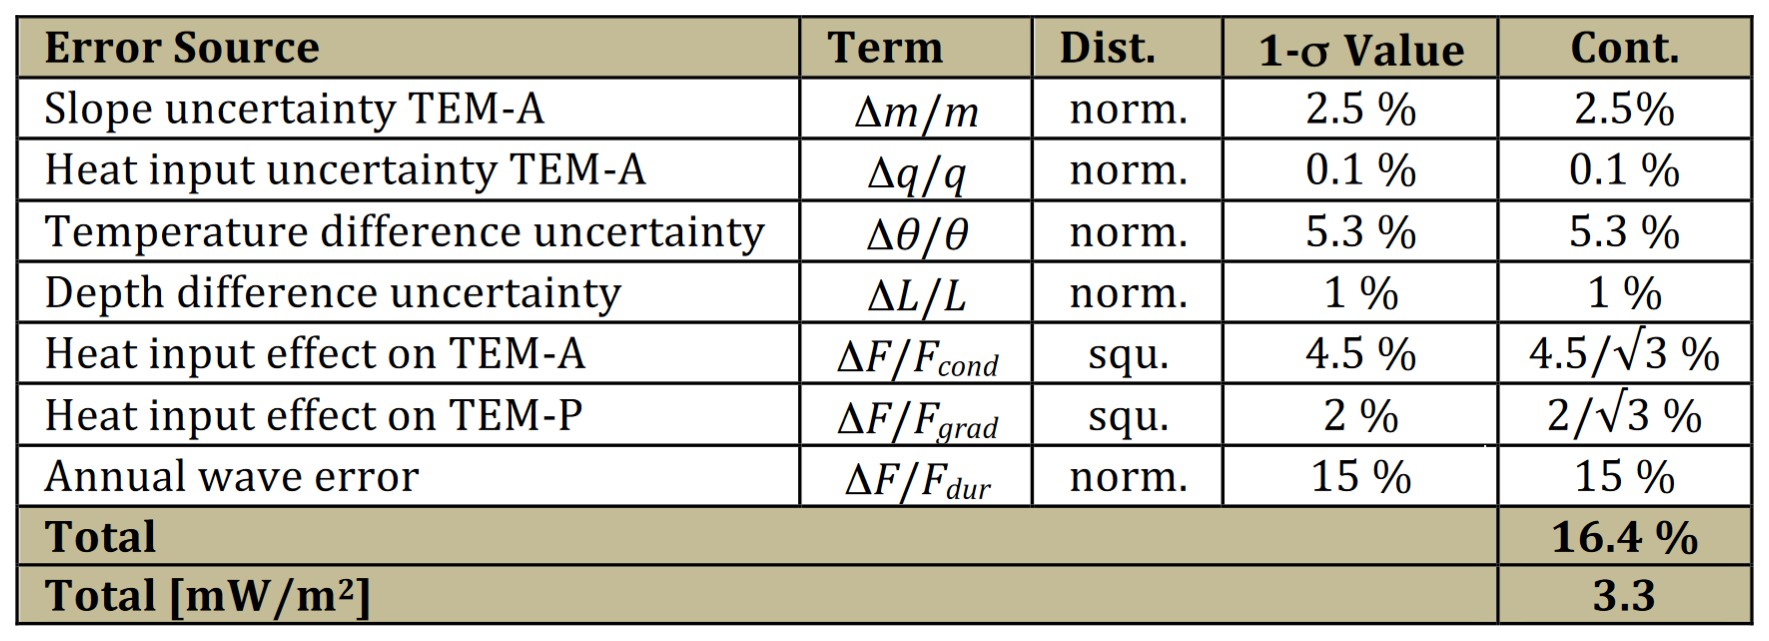
Error budget for a nominal planetary heat flow of 20 mW/m2.
Radiometer Calibration
The radiometer undergoes radiometric and geometric calibration prior to integration into the lander. The radiometric calibration was carried out under an atmosphere of 8 mbar Ar. As a calibration target, a cavity blackbody, type BB100 (Sapritzky et al., 2003) was used. The blackbody is temperature stabilized at temperatures of TBB = 150 K to 300 K with an accuracy and homogeneity of ~50 mK. The blackbody cavity is open to the pressure vessel and the instrument is mounted to view into the cavity. The radiometer was mounted inside a thermal shroud that was temperature controlled within the temperature range of expected Mars environment temperatures of Tshroud = 150 K to 300 K.
The radiometer will be calibrated after landing to check for sensor drift. The inflight calibration consists of two measurement sequences, one of which will be executed during the night at the instruments nighttime setpoint (Tnight = -35°C) and the other during the day (Thot = +25°C). For each setpoint, the temperature of the calibration target will be varied to six setpoints. From these data, the sensitivity of the individual thermopile sensors will be derived.
see also